Risk Management
Overview
Section titled “Overview”Energy Copilot’s Risk Management module provides quantitative risk analytics for energy derivative portfolios. It combines standard financial risk methodologies (VaR, Greeks) with energy-specific risk factors (price spikes, weather volatility, renewable generation uncertainty).
Value at Risk (VaR)
Section titled “Value at Risk (VaR)”Energy Copilot implements two VaR methodologies:
Historical Simulation VaR
Section titled “Historical Simulation VaR”Historical Simulation VaR uses the actual distribution of historical price returns, without assuming a normal distribution. This captures the heavy tails and skewness characteristic of electricity prices:
VaR(1-day, 95%) = -P5th_percentile(Σ daily_pnl_changes over lookback_window × current_position)Parameters:
- Lookback window: 250 trading days (1 calendar year)
- Confidence level: 95% (standard) or 99% (regulatory reporting)
- Holding period: 1 day (operational) or 10 days (regulatory)
Monte Carlo VaR
Section titled “Monte Carlo VaR”Monte Carlo VaR simulates 10,000 price paths using a mean-reverting jump-diffusion model calibrated to NEM spot prices:
def simulate_nem_price( S0: float, # Current spot price kappa: float, # Mean reversion speed theta: float, # Long-run mean sigma: float, # Volatility lambda_j: float, # Jump intensity (spikes/year) mu_j: float, # Mean jump size sigma_j: float, # Jump size std dev T: float, # Time horizon (days) n_sims: int = 10000) -> np.ndarray: """ Merton jump-diffusion with mean reversion. Parameters calibrated separately per region from historical data. """ ...Risk Dashboard
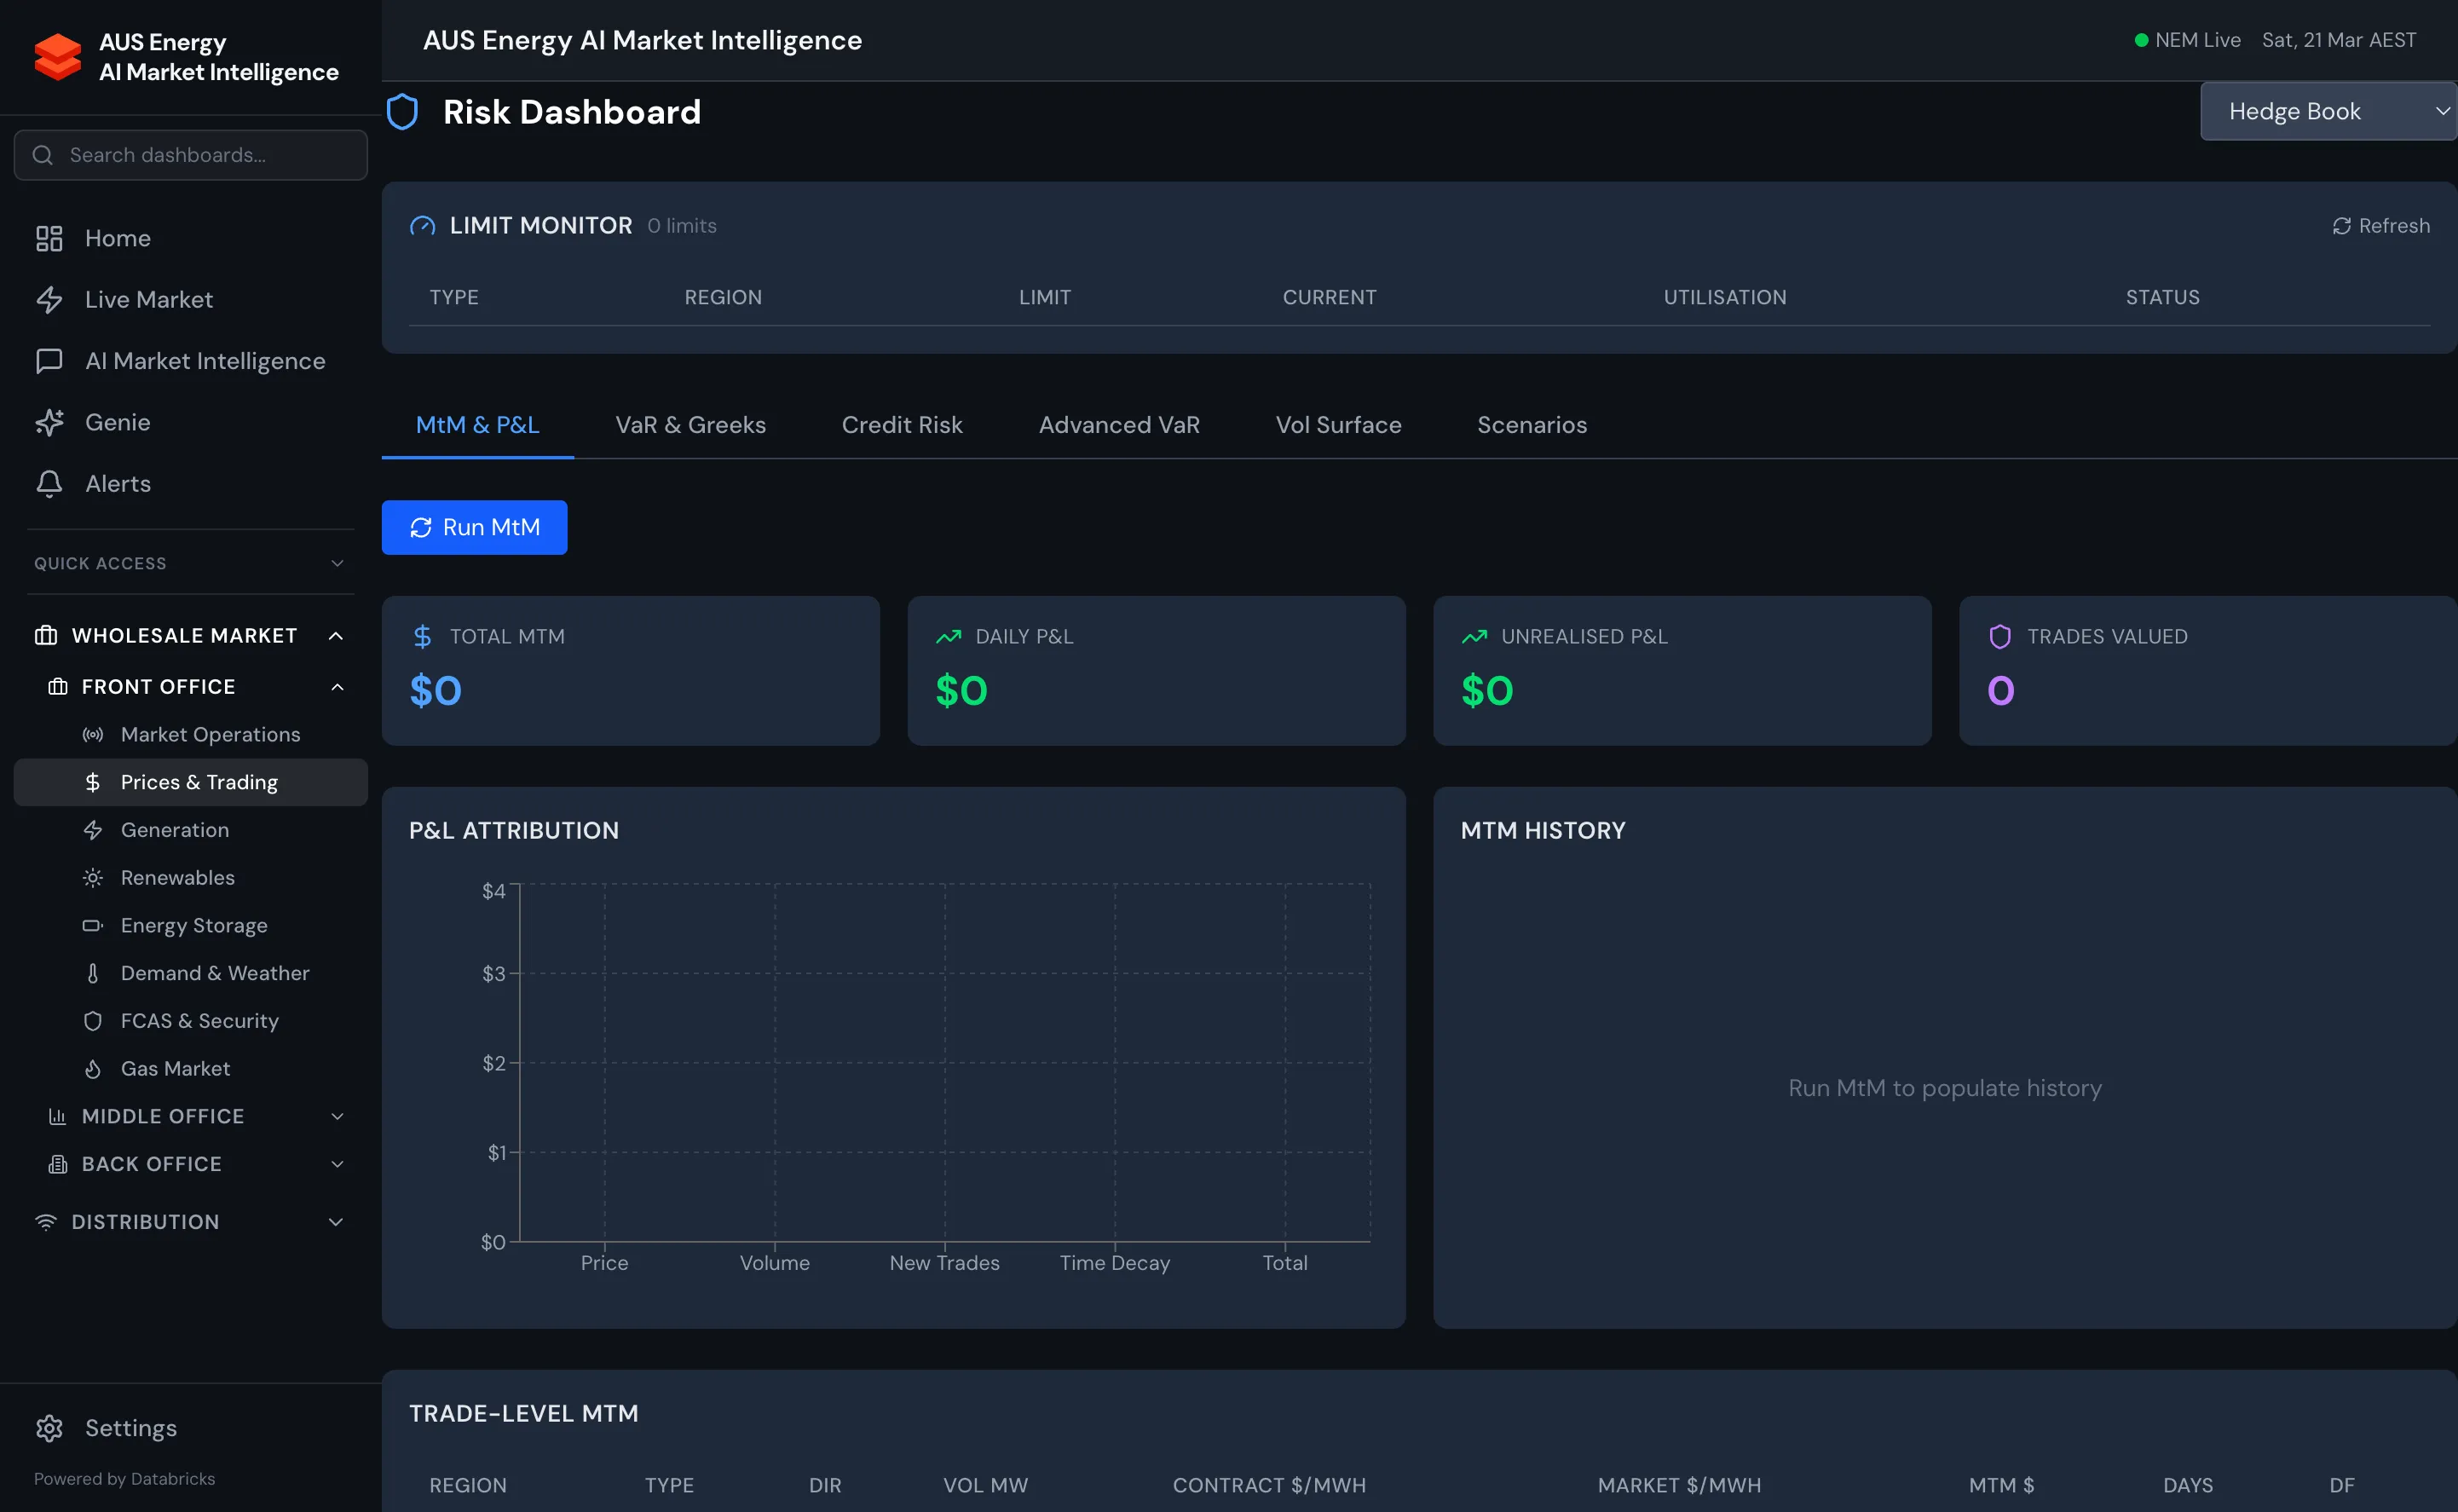
Section titled “Risk Dashboard”VaR Summary (/middle-office/risk/var)
Section titled “VaR Summary (/middle-office/risk/var)”- VaR at 95% and 99% confidence for each portfolio and the total book
- Comparison: Historical Simulation vs Monte Carlo VaR
- Back-testing: how many days in the past year did actual losses exceed VaR?
- Stressed VaR: VaR recalculated on the 2009 January heatwave scenario
Risk Factor Attribution
Section titled “Risk Factor Attribution”The risk is decomposed by driver:
| Risk Factor | Description | Method |
|---|---|---|
| Region Price Risk | Exposure to spot price movements per region | Delta × price volatility |
| Tenor Risk | Exposure to curve shape changes | DV01 per tenor bucket |
| Volatility Risk | Options book exposure to implied vol changes | Vega × vol change |
| Correlation Risk | Regional price correlation breakdown | Off-diagonal covariance |
| Jump Risk | Spike event impact on unhedged positions | Monte Carlo jump paths |
Greeks for Options and PPAs
Section titled “Greeks for Options and PPAs”Cap and Floor Greeks
Section titled “Cap and Floor Greeks”For options positions (caps, floors, collars), Energy Copilot calculates Black-76 Greeks:
| Greek | Symbol | Interpretation |
|---|---|---|
| Delta | Δ | Change in option value per $1 change in forward price |
| Gamma | Γ | Rate of change of delta per $1 change in forward price |
| Vega | ν | Change in option value per 1% change in implied volatility |
| Theta | θ | Daily time decay (option value lost per day) |
| Rho | ρ | Sensitivity to risk-free rate (small in energy markets) |
PPA Greeks
Section titled “PPA Greeks”Power Purchase Agreements (PPAs) have price and volume risk:
- Price Delta: sensitivity to change in wholesale forward prices
- Volume Uncertainty: P90/P50/P10 generation scenarios affect actual settlement
- Cannibalisation Risk: correlated generation across renewable fleet reduces captured prices
Credit Risk
Section titled “Credit Risk”Credit risk measures the exposure to counterparty default:
Credit_Exposure = max(0, MtM_value)Credit_Limit_Utilisation = Credit_Exposure / Credit_Limit × 100The platform generates alerts when any counterparty’s credit utilisation exceeds 80% of their approved limit.
Credit risk metrics:
- Current Exposure: sum of positive MtM values per counterparty
- Potential Future Exposure (PFE): maximum exposure at 97.5% confidence over deal life
- CVA (Credit Value Adjustment): discount for counterparty default probability
Position Limits Monitoring
Section titled “Position Limits Monitoring”Real-time limit monitoring against defined thresholds:
-- Query current limit utilisationSELECT portfolio_name, limit_type, current_value, limit_value, ROUND(current_value / limit_value * 100, 1) AS utilisation_pct, CASE WHEN current_value / limit_value > 1.0 THEN 'BREACH' WHEN current_value / limit_value > 0.9 THEN 'WARNING' WHEN current_value / limit_value > 0.8 THEN 'CAUTION' ELSE 'OK' END AS statusFROM energy_copilot.gold.limit_monitoringORDER BY utilisation_pct DESC;API Endpoints
Section titled “API Endpoints”# VaR summaryGET /api/risk/var?portfolio_id=1&confidence=0.95&method=historical
# Monte Carlo simulation resultsGET /api/risk/montecarlo?portfolio_id=1&n_sims=10000
# Greeks for options bookGET /api/risk/greeks?portfolio_id=1
# Credit exposure by counterpartyGET /api/risk/credit-exposure
# Limit monitoring statusGET /api/risk/limits?portfolio_id=1