Genie AI/BI Spaces
Overview
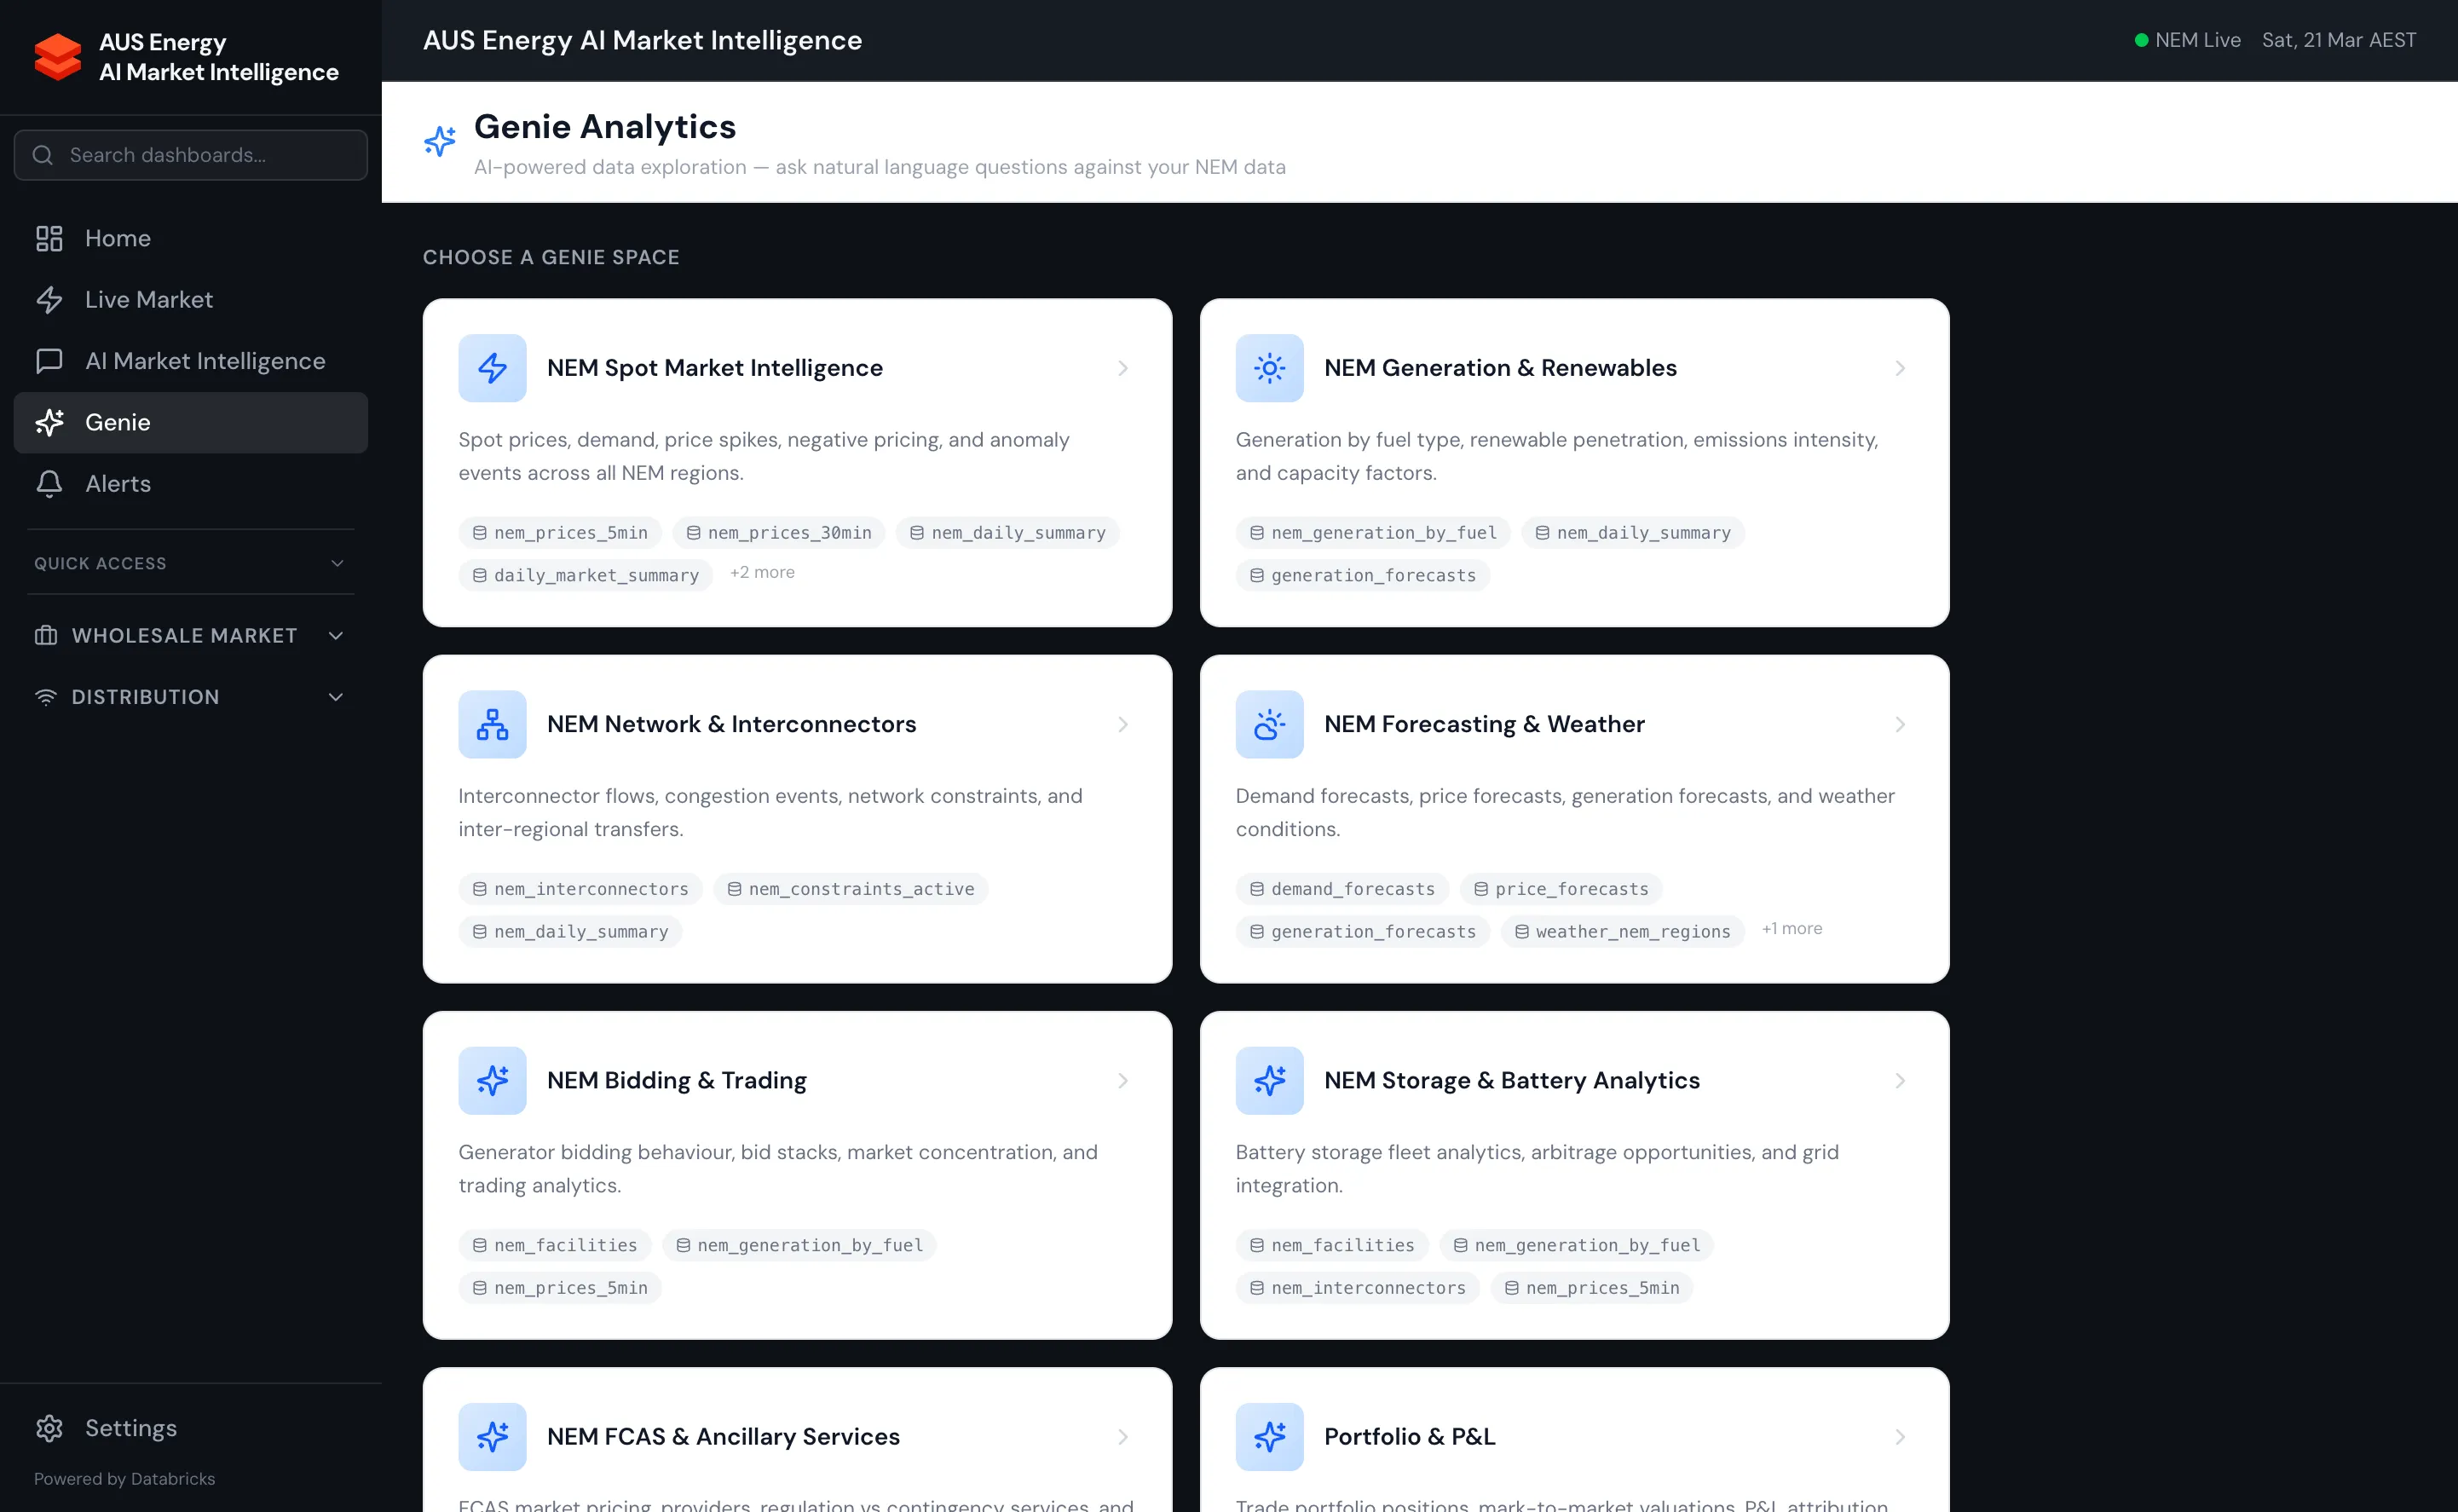
Section titled “Overview”Databricks Genie AI/BI provides a natural language interface directly to Delta tables. Users type a question in plain English; Genie translates it to SQL, executes it against the Gold tables, and returns results as a table or chart — with the generated SQL visible for transparency.
Energy Copilot configures 16 Genie spaces, each optimised for a specific domain with curated semantic metadata (table and column descriptions, glossary terms, and benchmark questions).
How Genie Works
Section titled “How Genie Works”User Question (natural language) │ ▼Genie NL-to-SQL model │ (Uses table/column metadata + glossary) ▼Generated SQL │ ▼ ExecuteDatabricks SQL Warehouse │ ▼Results (table + auto-chart)Genie uses Unity Catalog table and column COMMENT annotations as context for SQL generation. All 113+ Gold tables have column-level COMMENT annotations specifically to improve Genie accuracy.
The 16 Genie Spaces
Section titled “The 16 Genie Spaces”1. NEM Spot Market Intelligence
Section titled “1. NEM Spot Market Intelligence”Primary tables: nem_prices_5min, nem_prices_30min, nem_daily_summary, daily_market_summary, anomaly_events, demand_actuals
Sample questions:
- “What was the average spot price by region last week?”
- “Show me all price spike events above $1000/MWh”
- “Which region had the most negative pricing intervals?”
- “What is the daily price volatility trend for SA1?”
- “Compare average spot prices between NSW1 and VIC1 this month”
2. NEM Generation & Renewables
Section titled “2. NEM Generation & Renewables”Primary tables: nem_generation_by_fuel, nem_daily_summary, generation_forecasts
Sample questions:
- “What is the current renewable energy share by region?”
- “Show the daily renewables percentage trend over the last month”
- “Which regions have the highest solar generation right now?”
- “Show coal generation declining trend over the past 2 years”
3. NEM Network & Interconnectors
Section titled “3. NEM Network & Interconnectors”Primary tables: nem_interconnectors, nem_constraints_active, nem_daily_summary
Sample questions:
- “What is the average utilization of each interconnector?”
- “Show the flow pattern between NSW and QLD over the last week”
- “When did Basslink last reach its export limit?”
- “How often does V-SA reach its import limit during summer?“
4. NEM Forecasting & Weather
Section titled “4. NEM Forecasting & Weather”Primary tables: demand_forecasts, price_forecasts, generation_forecasts, weather_nem_regions, demand_actuals
Sample questions:
- “How accurate are the demand forecasts for NSW1?”
- “Show forecast vs actual demand for the last 24 hours”
- “What temperature is forecast for SA1 this week?”
- “Compare P10/P50/P90 price forecasts for VIC1 tomorrow”
5. NEM Bidding & Trading
Section titled “5. NEM Bidding & Trading”Primary tables: nem_facilities, nem_generation_by_fuel, nem_prices_5min
Sample questions:
- “What is the total generation capacity by fuel type across all NEM regions?”
- “Which generators have the largest capacity in Queensland?”
- “Which generators are currently dispatched above their registered capacity?“
6. NEM Storage & Battery Analytics
Section titled “6. NEM Storage & Battery Analytics”Primary tables: nem_facilities, nem_generation_by_fuel, nem_interconnectors, nem_prices_5min
Sample questions:
- “How many battery storage units are registered in each NEM region?”
- “What is the total battery charging and discharging capacity by region?”
- “Which batteries are currently charging vs discharging?”
- “Show battery dispatch patterns during peak price events”
7. NEM FCAS & Ancillary Services
Section titled “7. NEM FCAS & Ancillary Services”Primary tables: nem_facilities, nem_generation_by_fuel, nem_prices_5min, gold_nem_fcas_prices
Sample questions:
- “What is the average clearing price for each FCAS service type in the last 24 hours?”
- “Which FCAS service has the highest clearing price right now?”
- “Show FCAS price spikes during contingency events this month”
- “Compare Regulation Raise vs Regulation Lower prices over the past year”
8. Portfolio & P&L
Section titled “8. Portfolio & P&L”Primary tables: approval_requests, approval_rules, counterparties, credit_exposure, pnl_attribution, portfolio_mtm, portfolios, risk_metrics, trades
Sample questions:
- “What is the total MtM value by region?”
- “Show me the P&L attribution breakdown for this month”
- “Which counterparties have the highest credit exposure?”
- “What trades were booked this week and their current MtM?“
9. NEM Bidding & Revenue Optimisation
Section titled “9. NEM Bidding & Revenue Optimisation”Primary tables: bids_submitted, bid_optimization_results, dispatch_conformance, revenue_attribution
Sample questions:
- “Show all bids for Bayswater in the last 7 days”
- “What is the average bid price by band across NSW generators?”
- “Which generators have the best dispatch conformance rate?”
- “Compare actual vs ML-optimal revenue for Loy Yang A”
10. Gas Market Analytics
Section titled “10. Gas Market Analytics”Primary tables: gas_sttm_prices, gas_dwgm_prices, gas_spark_spreads, gas_hub_prices
Sample questions:
- “What is the average STTM gas price by hub this month?”
- “Show the ex-ante vs ex-post price for Sydney hub”
- “Compare Adelaide vs Brisbane STTM prices over the past 6 months”
- “When was the highest STTM price recorded at Wallumbilla?“
11. WEM Market Analytics
Section titled “11. WEM Market Analytics”Primary tables: wem_balancing_prices, wem_generation, wem_demand
Sample questions:
- “What is the average WEM balancing price this week?”
- “Show the WEM price distribution over the last 30 days”
- “Compare WEM vs NEM average prices this quarter”
- “What is the current renewable generation share in WEM?“
12. Network Operations & Reliability
Section titled “12. Network Operations & Reliability”Primary tables: network_assets, asset_loading_5min, voltage_monitoring, outage_events, reliability_kpis, power_quality
Sample questions:
- “Which zone substations had the highest average utilization in the last 24 hours?”
- “Which assets are above 90% utilization right now?”
- “Show SAIDI/SAIFI trend by DNSP over the past 3 years”
- “List all active outages and estimated restoration times”
13. DER & Hosting Capacity
Section titled “13. DER & Hosting Capacity”Primary tables: der_fleet, hosting_capacity, curtailment_events, vpp_dispatch_events, doe_compliance, der_output_estimated
Sample questions:
- “What is the total installed rooftop solar capacity by zone substation?”
- “Show the breakdown of DER installations by technology type and region”
- “Which feeders have the least remaining hosting capacity?”
- “How many curtailment events occurred this month and what was the energy impact?“
14. Network Planning & EV Impact
Section titled “14. Network Planning & EV Impact”Primary tables: demand_forecast_spatial, network_constraints_register, ev_network_impact, ev_charging_profiles
Sample questions:
- “Which zone substations have the highest peak demand growth by 2030 under BAU?”
- “Compare peak demand across BAU vs combined scenario for 2028”
- “Which network constraints have the most breach years forecast?”
- “What is the projected EV charging load by region for 2027?“
15. Settlement & Finance
Section titled “15. Settlement & Finance”Primary tables: settlement_runs, settlement_charges, settlement_journals, settlement_disputes, settlement_gl_mapping, settlement_evidence
Sample questions:
- “Show all settlement runs with their status, AEMO total, and variance percentage”
- “Which settlement runs have variance above $50,000?”
- “What was our net settlement position for the last completed run?”
- “Show the PRELIM to FINAL true-up by charge type”
16. DNSP Enterprise Intelligence
Section titled “16. DNSP Enterprise Intelligence”Primary tables: rin_submissions, stpis_performance, revenue_monitoring, pricing_proposals, regulatory_milestones, network_tariff_structures, bmp_asset_register, elc_inspections, fire_risk_incidents, bmp_spend, cso_payments, rural_feeder_performance, connection_applications, timely_connections_kpi, capital_projects, fault_response_kpis
Sample questions:
- “What is the current STPIS performance score for AusNet Services?”
- “Which DNSPs are at risk of missing their AER revenue cap?”
- “Show BMP capex spend vs allowance by DNSP”
- “Which DNSPs have overdue RIN submissions?”
- “What is the timely connections rate by DNSP this quarter?”
Space Configuration
Section titled “Space Configuration”Each Genie space is configured with semantic metadata to improve SQL generation accuracy:
# From setup/04_create_genie_spaces.pyspace_config = { "displayName": "NEM Spot Market Intelligence", "description": "Spot prices, demand, price spikes, negative pricing, and anomaly events across all NEM regions.", "tables": [ { "catalog": "energy_copilot_catalog", "schema": "gold", "table": "nem_prices_5min", "description": "5-minute NEM dispatch prices for all regions.", "columns": [...] } ], "sampleQuestions": [ "What was the average spot price by region last week?", ... ], "glossary": { "RRP": "Regional Reference Price — the wholesale spot price for a NEM region", "SAIDI": "System Average Interruption Duration Index", ... }}Adding New Genie Spaces
Section titled “Adding New Genie Spaces”To add a new Genie space:
- Identify the Gold tables to include
- Ensure all table and column COMMENTs are comprehensive
- Prepare 15 sample benchmark questions
- Prepare a domain glossary (10+ terms)
- Add the space configuration to
setup/04_create_genie_spaces.py - Run the setup script:
databricks jobs run-now --job-id <SETUP_JOB_ID> \ --python-params '["create_genie_only"]' \ --profile=my-profileGenie vs Copilot
Section titled “Genie vs Copilot”| Feature | Genie AI/BI | AI Copilot |
|---|---|---|
| Interface | Direct question → SQL → result | Conversational chat |
| SQL visibility | Yes (show SQL) | No (abstracted) |
| Custom tool calling | No | Yes (58 tools) |
| Multi-step reasoning | Limited | Yes (agentic loop) |
| ML model access | No | Yes |
| Real-time data | Yes (direct table access) | Yes (via tool calls) |
| Best for | Direct data queries, ad hoc SQL | Complex analysis, trading actions, narratives |